16 Dec 2013

What's going on at Pasir Ris beach?

I had a short and relaxing break at a family-organised chalet in Aloha Loyang and thoroughly enjoyed the good food and company in my 2D1N stay there. As usual, I went on a very small scale exploration of the Pasir Ris breah coastline just outside the chalet area but was taken aback by the amount of trash and dead organisms on the beach.

Heavily littered coastline. I believe that most of the trash is derived from Pulau Ubin that is directly opposite..

More trash and P. Ubin in the distance

I am not very sure why there is just so many dead organisms here. Within a 50 metre stretch of sand, I have counted about 5 dead horseshoe crabs, 6 dead fishes, 2 dead crabs and likely to be many many more, since I wasn't paying attention to every detail. The Loyang Shipyard was close by and the pollution derived from it could be a possible reason.

Dead horseshoe crab

Dead filefish

Dead unidentified fish

Dead catfish?

Dead flower swimming crab

Dead swimming crab

More trash is seen during the lowest tide of about 80 cm

Durian husk. (hrmm)

Grey heron flew by. :)

Pair of Oriental Pied Hornbills in the distance..

Was mind-blowned by the trashy beach until I heard some squeaks and spotted a pod of Smooth-coated Otters swimming pretty fast along the coast. Most had fishes in their mouth and I wonder if those fishes are even healthy/fresh ones to begin with. :/

In short, this experience serves as a great reminder of the need to manage our waste properly and not throw them into the sea in an irresponsible manner... Gotta keep our beaches clean!! >_<

9 Dec 2013

Adventures - Cusuco National Park, Honduras

I've never really made an effort to blog about the field trip in Honduras (country in Central America) and here it is.

I was there with Operational Wallacea, as a research assistant to the terrestrial scientists in Cusuco National Park. I did the research assistant module on Jungle Survival and Neo-tropical Ecology.

So where in the world is Honduras/Cusuco NP?

It is a Central American country (zoom out on map).

It's a unique biogeographical region North of the Ismuth of Panama, a famous land strip which linked North and South America about 3 million years ago (Leigh et al 2013).

Cusuco National Park is near to San Pedro Sula, the capital city (North of Honduras). In order make way for coffee plantations, some of the national park has been destroyed and has been at threat of further destruction.


How did we all get to the field site?

It was a 2 hour + journey by (magic-school) bus, then a four-wheel drive to the Cusuco National Park.

Throughout the bumpy four-wheel drive, we got to see vegetational differences with elevation - a mixed forest essentially. It is the Southern-most limit of some North American plant species together with South-American species such as Bromeliads.

Four-wheel Drive to Cusuco National Park from San Pedro Sula (Capital City of Honduras). Our luggage in one truck (above).

The road was quite bumpy. 

What did we do as research assistants?

In the first week, we did the module on Jungle Survival and Neotropical Ecology at the base camp.

Neotropical Ecology: sat in for lectures
Jungle Survival: went in the "jungles" to learn how to "survive" on bare necessities. We learnt how to pitch hammocks with tarps, 

It got pretty cold at night and in the mornings for a tropical-dweller like me. Bathing was a pain though, in that sense. No one really bothered to bathe much anyway - but I did because of rashes.

In the subsequent week(s), one could choose to stay in the base camp to be a research assistant or move on to satellite camps. I chose to move on to the satellite camps, to El Danto which was a six-hour hike away (note: pack light). 

Fieldwork to look for frogs and reptiles.

Tents in camp which we stayed in at camp. We stayed in hammocks when out in the field. 

At the satellite camp, El Danto.

The six-hour hike to El Danto satellite camp.

What was the best thing about the trip?

To me, the best thing about the trip was probably the scenery and unique flora and fauna seen in the trip. Sadly, I think I did not spend enough time there to appreciate it more or do more fieldwork. 
  • There were mixed forests, and there was a pretty amazing dwarf forest (bosque enaƱo). 
  • South American and North American flora in one place.
  • There were orchids in the cloud forests. 
  • Jewel scarabs (which I didn't get to see), dung beetles, humming birds (Mountain Gem), Quetzal (which I didn't get to see) and frogs as well.
  • Surprisingly no fishes in Cusuco except for Poecillids

Almost above the clouds.

Pristine streams.

Pools

Bromeliads abound.

Beautiful tree ferns.

Rushing water.

How was sanitation like?

This might be a question lots of people would ask. Generally, there were places to bathe in, at the camps. However, many would choose not to bathe often because the weather was cool enough. There were flush toilets at the base camp and ditches dug at the satellite camp I went to. It didn't stink so that was good.

Well, it is field work after all and don't expect urban living.

Camp site.
"Ecofriendly" spots to brush teeth/spit.

Pathway to the toilet.


References

4 Dec 2013

Things we do for class - Species pages

For most of the last semester, we have been working on these species pages for our taxonomy class. Eunice's page is none other than being focused on what she does best, ANTs. And so her target species is Proatta butteli, a really interesting ant. As for me, I have decided to focus on a bird species, the Common Hill Myna (Gracula religiosa). The reason for doing so is because I have a love for birds too (not just dung beetles) and this species is one of my favourites.


Screenshots of our species pages. TOP: Proatta butteli. BOTTOM: Gracula religiosa

Our pages are found at this website, http://taxo4254.wikispaces.com/, together with other species pages done by other students as well. Enjoy~

2 Dec 2013

Cartography and Visualisation IV: Map Design


Visual Variables

Visual variables can vary in the following manner:

Size: the thickness/size of a symbol
Value: the lightness/darkness of a colour
Hue: shade of a colour (element on the colour wheel; a pure colour)
Saturation: purity of the colour; also known as chroma
Orientation: the direction of the symbol
Shape: the type shape used for symbolisation
Arrangement: the way in which the symbol is arranged
Texture


Colours 

Colours used limited by: 1) human vision, 2) colour specification of systems, 3) colours in map design

1) Human Vision


A beautiful video on the physics of colour

Electromagnetic spectrum: 400nm-700nm for the visible range

Two Theories on vision: 

Trichromatic theory: condition of possessing independent channels for conveying colour information, derived from three different cone types (cone cells). In reality there might be more than 3. (by Thomas Young, 18th century)

Opponent-process theory: psychological model that accounts for wide range of behaviours, including colours. We perceive colours as three independent receptor types of opposing pairs: white v. black, blue v. yellow, red v. green. (by Ewald Hering in the late 17th century)


A lecture on the Colour-Opponent Theory

It has been shown that both work hand-in-hand (physiological v. psychological).


Simultaneous contrast: appearance of a colour in a display depends on colour that surrounds it
Successive contrast: colours modified in the order they are seen 

A video illustrating simultaneous colour


2) Colour specification of systems

Things to note:
Printer-friendly
Colour-blind friendly
Black/white printer

3) Colours in map design

Colour conventions: e.g., blue for water, green for lush/thick vegetation, brown for land surfaces, red with warm/blue with cool temperature; red to advance, blue to retreat (because our eye lens bulge when we see red, similar to seeing objects close up)


Using it for figure-ground contrast


Schemes possible (i.e., http://colorbrewer2.org/)

  • Qualitative schemes: represented by the difference in hues
  • Binary schemes: represent with differences in value, holding hue constant, unless it is used to represent qualitative difference (then hue difference might be fine)
  • Sequential schemes: represent data in sequence; generally represented with value difference, hue held constant
  • Diverging schemes: focus on a mid-point and variations out from that mid-point

Colour Brewer. Allows you to select for sequential, diverging colour schemes. Not included: binary scheme.

Typography

Why text are required in a GRAPHIC map:

  • Labelling: clear and unambiguous communication; ‘symbols for meaning’
  • Organising: structure, visual hierarchy, location, spatial extent
  • Explaining: graphics cannot explain everything, title/legends/explanatory text

Typography is the usage of design in text (type).


Letter form components:
X-height: height between base and mean-line; a font with a large x-height is said to be more readable (though a quick search on the internet says that this is a myth)
Serif: the line at the end of a letter

Type characteristics:
Type family: a group of type designs that reflect common characteristics
Typeface: combination of type of a particular style and family
Style: italics used more for natural features; also for identification of publication though it is harder to read, water features;
Font: a set of all alphanumeric and special characters of a particular type family, style and size
Spacing: (between letters) kerning, (between lines) leading; letter spacing for words in uppercase so it is more readable (i.e., outline is more visually dominant than inner space)
Type size: implies ordered relationships; larger of greater importance; small sizes should be avoided (4-5point)
Type weight: bold implies greater quantity; light type may not always be available in a mapping type
Case: lower case for easier word recognition, uppercase for mountain ranges, lower cases for other natural features; more important/ larger features with the usage of uppercase
Type face and lettering harmony: one typeface should be used across the map; multiple variants of a type face can be used
Masking: background (“highlight”)
Hallow: border around text
Callout: with speech bubble

Type is important to convey the message you wish to give to your audience.
As much as possible, it should be light in shading, enough kerning between the letters.
Capitalisation should be avoided unless its for a major area.
Finally, the most important thing is readability. :)


History of Typography

 
What is typography

Layout

*this section is still work in progress


Planar Organisation

Balance
Rudolf Arnheim’s visual principles of balance: weight & direction


Variables that confer more/less weight
Location: at structural net (via golden ratio)/ not at structural net, right/left, top/bottom, away from centre/near centre
Shape: regular/irregular, compact/not compact
Colour/ Interest/ isolation: type of colour (red/blue, bright/dark, white/black), instrinsic interest/none, isolated/surrounded
Size: large/small

Variables that confer direction or not
Location: isolated/ 'is surrounded'/ 'is in centre'
Shape: can direct with axes
Subject matter: can direct based on interest


Internal organisation

WHAT: An ordered map arranges the graphic and/or intellectual elements into a composition that develops a clear visual expression
HOW: Through alignment in two steps: 1) Intraparallelism - aligning map elements with each other to simplify the map 2) Alignment corrections via continual separations between groups of elements
WHY: Reduces tension

source: http://www.gitta.info/LayoutDesign/en/html/DefOrgMapEle_learningObject3.html

Hierarchical organisation

Figure: important objects that should stand out against the background
Ground: less important objects that form the background

Perceptual grouping: the map viewer spontaneously combines elements in the visual field that share similar properties, resulting in new forms or ‘wholes’ in the visual experience; this can be done so by shape, size or proximity

Contrast: visual differences between the map features that allow us to distinguish one from another, achieved through considering line/ texture/ colour (value and hue)

-> Line contrast: edges
-> Texture contrast: pattern of small symbols repeated in such a way that the eye can perceive individual elements
-> Value contrast: e.g., using a dark colour as the background and lighter colour as the foreground (Arnheim’s rule)

Closure: the tendency for perceiver of the map to complete unfinished objects

Vignetting: graphic emerging from an edge or border resulting in a continuous gradient of brightness (for land-water contrast)


Cartography and Visualisation III: Map Elements

This is gonna be a short post. It'll cover the essential elements of a map - what most maps should have within the "area". However, it is subject to the requirements of the publication/ report.

This is Part III of the four-part instalment on: 

1) projections,
2) geographical phenomenon and data representation,
3) map elements,
4) map design (colour, typography, planar organisation and hierarchical organisation)


Just a teaser to begin with: WHY MAPS ARE COOL


Ok back to business:

Map was made by myself for an assignment.

Title/Subtitle: for a concise description of the map’s theme (not wordy, no abbreviations). This can be replaced with a caption, if in the case of a report.

Legend: defines all of the thematic symbols of a map; symbols that are self-explanatory or not directly related to map’s theme are normally omitted

Frame line: encloses the entire map and neat line: encloses the mapped area

Data source, credits: where the data for the thematic map is obtained, base information normally omitted

Scale: representative fraction of the map to reality and could be a verbal or bar scale. However, whether to use a scale might depend on whether the map is equal-area or not. If it is not equal area, then putting the scale bar is meaningless.

Orientation represented by north arrow, graticule. However, whether to use a north arrow might depend on whether the angles varies throughout the map. If it does significantly, then adding the north arrow is pointless.

Inset: a smaller map included within the context of a larger map

Place names/ labelling

Cartography and Visualisation II: Geographic Phenomenon & Data Representation

In this second instalment, I will cover Geographic Phenomenon & Data Representation.

This is Part II of the four-part instalment on:
1) projections,
2) geographical phenomenon and data representation,
3) map elements,
4) map design (colour, typography, planar organisation and hierarchical organisation)

What is geographic phenomenon?

It is a data that is spatially distributed. It can hence be abrupt or smooth in nature (with reference to whether there is a break in the data, usually between enumeration units), and can also be continuous or discrete (with reference to the number of decimal places on the number).

Data can be qualitative (=deals with apparent qualities [subjective properties]), or quantitative (=type of information based on quantities [objective, measureable]).

Qualitative data -> nominal
Quantitative data -> ordinal (ranking), interval (arbitrary 0), ratio (non-arbitrary 0)

There are a total of FIVE common mapping methods.

How can geographic phenomenon be represented?

It is usually represented in a thematic map, which is made up of a basemap and a thematic layer. A thematic map usually shows a specific theme connected with a geographic area. This is as opposed to a general purpose map (=General purpose map: many types of information on one map; most atlas maps, wall maps, road maps fall into this category; the map aims to give a broad understanding of location and features of an area (e.g., location of urban places, type of landscape, major transportation routes).

Different types of data can be represented in different types of 'conventional methods'.

Choropleth: having enumeration units (e.g. area) bounded by isolines to represent a distinctive colour/shading to represent a particular geographical phenomenon; values represented can be derived or totals; areas represented are usually administrative areas or statistical areas

Choropleth map with different classification methods

Dasymetric: using ancillary information to map enumeration units at a finer scale; corrects for ‘ecological fallacy’ that occurs with choropleth mapping; uses standardized data but places areal symbols that take into consideration actual changing densities within the boundaries of the map

-> Enumeration units: (in the case of a choropleth map) a uniform unit representing a single data point and is bounded by lines

-> Classification methods: grouping data into various classes by a certain method (e.g., 1) equal interval; 2) standard deviation; 3) Quantiles; 4) Natural breaks (Jenks); 5) Arbitrary)
  • Equal interval: each class occupies an equal interval along the number line
  • Standard deviation: class boundaries are defined by standard deviation
  • Quantiles: assures an equal number of values in each class
  • Natural areas: idiographic data classification that classify data into distinct groups based on a histogram distribution; via visual inspection or Jenks optimization
  • Arbitrary schemes: using arbitrarily-set classes; using regular rounded numbers having no relevance as distributional classes

Dot mapping: using dots to represent absolute numbers within an enumeration unit; the placement of dots can be uniform, geographically weighted (i.e., spatial autocorrelation) and geographically based (on ancillary information)

-> Ancillary information: complementary information that includes existing topographic maps, remote sensing data, meterological data, policies etc.

Isoarithmic: (e.g., isometric -> true point data to isoplethic -> conceptual point data) planimetric graphic representation of a three-dimensional volume via a system of line symbols to represent a 3D volume or mental construct; requires interpolation between control points

-> Interpolation: joining of points (i.e. control points) via a manual or automated process to form a continuous line representing a particular value
-> Manual interpolation: via methods of joining neighbouring control points with straight lines, to create lines of contours (isolines), in assuming that distribution of mapped changes in a linear fashion
-> Automated interpolation: via automated methods such as Delaunay triangles (via triangulation, triangle-based) Theissen polygons (via triangulation, polygon-based), Inverse-distance (gridding: making use of a grid and interpolating distances between nodes to get an estimation), Kriging 


Proportional symbol: a type of thematic map where data represented by a point symbol whose size varies with the data attribute values (goal of the map to show relative magnitudes [e.g., true point data or conceptual point data] of phenomena at specific locations); can be used for ordinal, interval and ratio data (quantitative data)

Proportional symbols, with range-grading (Dent).


Three Methods:
-> Absolute scaling: direct proportional scaling with the values it represents
-> Apparent-magnitude scaling: based on perception, with Flannery’s adjustment factor
-> Range-grading: (based on Dent 1999 or Meihoefer 1969) dividing data into groups, each group represented by a distinguishable proportional symbol; recommended to use five adjacent circles on a small scale map

Extra terminology:

Small scale map: large area
Large scale map: small area

Cartography and Visualisation I: Projections

I am writing a post about the terminologies in relation to Cartography and Visualisation, and in specific, how cartographic projections (i.e., the maps we hold in our hands) come about.

This is Part I of the four-part instalment on:
1) projections,
2) geographical phenomenon and data representation,
3) map elements,
4) map design (colour, typography, planar organisation and hierarchical organisation) 
The aim of this post is to be as concise as possible, adding definitions and diagrams to aid in your understanding of how projections came about, and also partly to help in my revision for the examinations (heh heh). The definitions are adapted in my own words from the online resources that I have read and my Cartography and Visualisation lecture notes.


Just a teaser to start:


Adapted from GE2227 notes. Redrawn by Eunice Soh.

Geoid: a hypothetical surface representing the form the earth’s oceans would take if there was no land and the water were free to respond to the earth’s gravitational and centrifugal forces; can vary up to 75 metres above/ 100 metres below the ellipsoid (i.e., orthometric height)

Here's a geoid viewer: http://geomatica.como.polimi.it/elab/geoid/geoidViewer.html

A video on geodesy

How all the cartography terminology are linked. First, one starts off with an ellipsoid which is a mathematical representation of the geoid. The ellipsoid is defined by its geodetic datum, with the following parameters: origin, semi-major axis and semi-minor axis. 

Reference spheroid/sphere/ellipsoid: a mathematically-defined surface that approximates the geoid, the truer figure of the earth, or other planetary body (e.g., WGS1984)

Datum:  a set of values that act as a base to which a geoid is referenced at a single point; (as geodetic datum): a model that describes the location, direction and scale relationships with respect to an origin on the Earth’s surface (i.e., semi-major axis [a], semi-minor axis [b], flattening ratio [b/a], origin); Singapore’s datum is SVY21 which is based on the WGS84 datum except for the difference in origin

A geographic coordinate system is a coordinate system that enables every location on the Earth to be specified by a set of numbers or letters.

Prime meridian: a longtitude which is defined as 0o; it is arbitrary, unlike the equator (vertical)
Equator: a latitude which is defined as 0oat the axis of rotation of the earth (horizontal)

What is a rhumbline (loxodrome)

Projected Coordinate Systems and their various properties. The black box are the actual names of the projection.

A projected coordinate system is a coordinate system projected from a geographic coordinate system, where a map projection is the systematic transformation of the curved, three dimensional surface of the planet into flat, two dimensional plane, resulting in distortion.

For a great video on projections, look here: http://education.nationalgeographic.com/education/media/selecting-map-projection/ and a cute cartoon about map projections: http://xkcd.com/977/

Another video on projections


How did the Mercator projection (azimuthal) come about 

Distortion: any projection that distorts the earth in some way (e.g., conformal -> angles preserved, areas distorted; equal area -> area preserved, angles distorted)

Certain projections can be a "compromise" (figure above).

A good read would be http://en.wikipedia.org/wiki/Map_projection


Decisions of a projection would depend on

  • Properties of the projection
  • Characters (scale, interrupted, aspect)
  • Deformation across mapped area
  • Projection centre
  • Familiarity

Properties of a projection

Major factors

  • Equivalence: Equal area 
  • Conformality: Equal angles 
Minor factors

  • Distance: Equidistance 
  • Direction: e.g., Azimuthal

1 Dec 2013

Ants of Kent Ridge: Part I (the ants)

An Informal List of the Ants of Kent Ridge (and adjacent green areas)

Kent Ridge has a myriad of ant species that forage about on the ground. These are ant species obtained by baiting with honey, tuna and peanut butter. The ants are also given a size "score" based on total length: tiny (<=3mm), medium (>3mm), large (>9mm). 

Subfamilies represented: Myrmicinae, Ponerinae, Dolichoderinae, Formicinae

Photographs by Eunice S.

If there are any misidentifications you feel strongly about, please feel free to comment on this blog and I will review it. As much as possible, I've tried to use the available taxonomic keys to identify them. 

Anoplolepis gracilipes (Smith 1857) Yellow Crazy Ant
Size: Medium
Nesting habit: in cracks, in the ground (opportunistic)

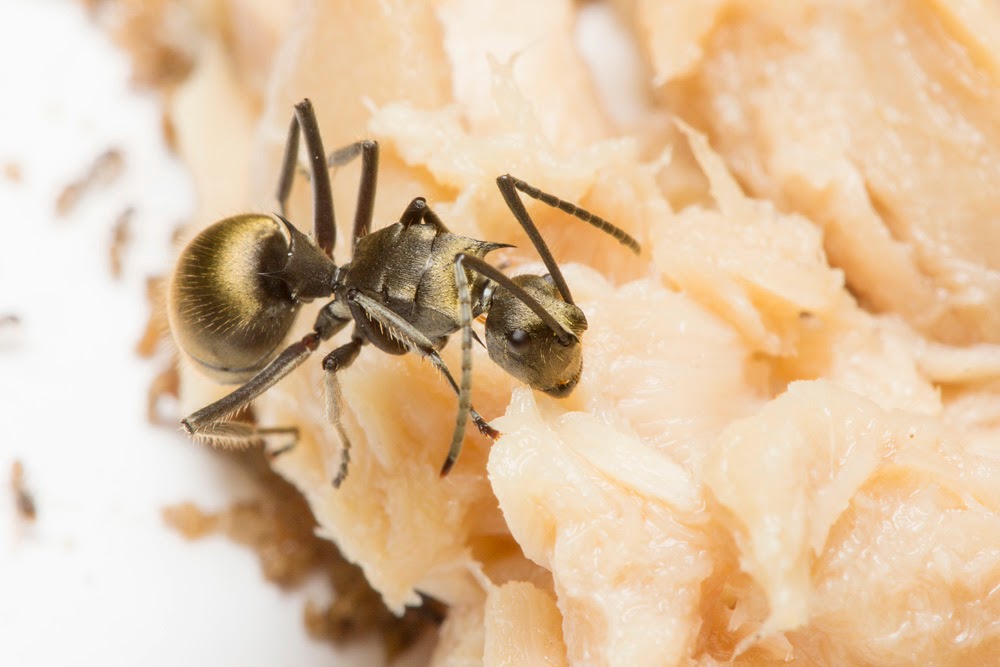
Camponotus cf. auriventris Emery 1889
Size: Medium
Nesting habit: excavates and nest in soil

Camponotus sp. 2 [cf. maculatus-group]
Size: Large
Nesting habit: Unsure

Camponotus sp. 3 [cf. albosparsus]
Size: Medium
Nesting habit: Nests in the ground.

[Camponotus sp. 4 is part of another inventory]

Camponotus sp. 5
Size: Large
Nesting habit: Likely arboreal.


Plagiolepis cf. exigua Forel 1894
Size: small
Nesting habit: In the ground.


Crematogaster (Orthocrema) biroi bandarensis Mayr, 1897 [ID by Shingo Hosoishi, Crematogaster expert]
Size: Medium
Nesting habit: Very likely to be in the ground (known from the subgenus) 

Crematogaster (Physocrema) sewardi Forel 1901 [ID by Shingo Hosoishi, Crematogaster expert]
http://www.antwiki.org/wiki/Crematogaster_sewardi 
Size: Medium
Nesting habit: Likely arboreal but not fully ascertained.


Philidris sp. 1 
Size: Medium
Nesting habit: Arboreal

Dolichoderus thoracicus (Smith 1860)
Size: Medium
Nesting habit: Arboreal, lives in hollow branches

Meranoplus bicolor (Guerin-Meneville 1844)
Size: Medium
Nesting habit: In the ground. Excavates its own nest.

Monomorium monomorium Bolton 1987
Size: Small
Nesting habit: Uncertain. Likely in the ground.

Oecophylla smaragdina smaragdina (Fabricius 1775)
Size: Large
Nesting habit: Uses leaves to make nest arboreally.

Nylandaria sp.
[corrected by James Trager, Myrmecologists Facebook forum]
Size: Medium
Nesting habit: unknown

Pheidole cf. parva Mayr 1865
Size: Small - Medium
Nesting habit: in the ground

[No photographs for Pheidole sp. 2 and Pheidole sp. 3]

Pheidole sp. 4
Size: Small - Medium
Nesting habit: in the ground

Pheidole sp. 5
Size: Medium
Nesting habit: unknown, probably in the ground

Pheidologeton (or Carebara sensu Fisher 2014) diversus (Jerdon 1851)
Size: Medium - Large
Nesting habit: in the ground and on the surface (but covered with sand)

Polyrhachis cf. proxima Bingham 1903
[not really sure if illaudata or proxima, but compared images on AntWeb and seem closer to proxima]
http://www.antweb.org/description.do?rank=species&name=proxima&genus=polyrhachis
Size: Large
Nesting habit: in the ground

Polyrhachis cf. abdominalis Emery 1896 [as suggested by Gordon Yong]
http://www.antweb.org/description.do?rank=species&name=abdominalis&genus=polyrhachis
Size: Large
Nesting habit: in bamboo

Tapinoma cf. melanocephalum Forel 1895 
[corrected by Jim Wetterer, Myrmecologists Facebook forum]
Size: Medium
Nesting habit: in cracks of the ground (opportunistic)

Tetramorium (tortosum species-group) sp. 1
Size: Medium
Nesting habit: in the ground 

Diacamma cf. rugosum (Le Guillou, 1842)
Size: Large
Nesting habit: in the ground, excavates its own nest

Odontomachus rixosus Smith 1857
Size: Large
Nesting habit: in the ground
Note: not present in Kent Ridge, for comparison purposes

Odontomachus simillimus Smith 1858
Size: Large
Nesting habit: in the ground, usually at the base of trees

Odontoponera denticulata (Smith 1857) 
[ID suggested by Wendy Wang, pers. comm. but haven't had the chance to examine the specimen properly; the antennal scape is quite short, dark integument seems to suggest it is denticulata but its rugae is fine, suggesting its transversa, have to check eye size, incision at petiole and propodeal denticles; also I do think both species (transversa and denticulata) exist in Singapore as I've gotten reddish forms found in forests and this darker form, found in urban areas]
Size: Large
Nesting habit: in the ground, excavates its own tunnel in the soil